Brazil’s landmass totals 8,525,000 km2, of which the Amazon region covers 5,000,000 km2. This biodiverse region is home to 400-plus species of mammals, 3,000 species of fish and 2,000 species of birds. Plant species reach into the tens of thousands. The array of natural products that can be derived from this wildly varied environment includes pigments, gums, fatty oils, medicinal and toxic plants, and of course aromatic plants from which essential oils are derived. This latter category is comprised of ~1,000 plants.
Yet there are challenges in harvesting the promise of these naturals. The annual rate of destruction in the Amazon has reached 26,000 km2. Between May 2000 and August 2005, Brazil lost more than 132,000 km2 of forest (an area larger than Greece) to pastures (60%), soy fields and subsistence agriculture. In addition, commercially important materials such as rosewood are becoming endangered.
Cosmetics and Perfumery Market in Brazil: Mapping Brazilian Aromatic Plants
Brazil is home to the seventh largest personal care, perfumery and cosmetics market in the world (see T-1 and T-2 for world market sizes by category and market sizes by retail value, respectively). About 1,400 companies in the country operate in this sector, with the top 16 companies responsible for 72.4% of total sales. (For details on top 10 companies, see T-3.) Brazilian personal care, perfumery and cosmetics sales totaled $6.4 billion in 2005. The last five years have witnessed an average growth of 10.7% (source: ABIHPEC, the Brazilian cosmetic society), despite a dearth of local technological efforts.
In 2004, Brazil ws the 10th largest essential oil importer ($42 million) in the world. Simultaneously, the country is the world’s fourth leading essential oil exporter (US$98 million). (For a rundown of key materials, see T-4.) The domestic cosmetic and perfumery industry fragments as follows: hair care 25%, fragrance 13%, oral care 10%, bath 10%, skin care 9% and deodorant 9% (source: ABIHPEC). The country’s growing sales rate in cosmetics (~17%) has outstripped everyone (including China), except for Argentina. The market share of the Brazilian cosmetics segment breaks down into: 69% personal care, 18% cosmetics and 13% perfumes.
The strong growth has sparked a competitive landscape, including national companies such as Dierberger, Centroflora & Anidro and Sanrisil; Amazonian interests such as Beraca-Brasmazon, Magama Industrial, Erva Ativa, Kaiorós (ex-Aromatica), Robert Mause and Benchimol (Bemol); and international interests including IFF, Givaudan, Firmenich and Mane.
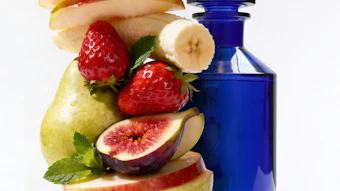
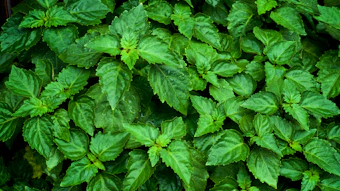
Brazil has already commercialized a number of traditional raw materials for the fragrance industry, including rosewood, tonka beans and copaiba. Some interesting emerging essential oils of the region include Cordia verbenaceae, Lippia sidoides, Schinus therebentifolium, Baccharis dracunculifolia, Piptadenia rigida, basil (Ocimum basilicum) and Priprioca (Cyperus articulatus). From Amazon new oils are being researched as Breu (Protium heptaphyllum), Aeolanthus suaveolens, Macacaporanga (Aniba parviflora) and rosewood leaf oil.
Address correspondence to Lauro E.S. Barata; [email protected].*Adapted from a presentation at Centifolia—6th International Congress on Perfumery and Natural Raw Materials, Grasse, France.
| T-1. World market for personal care, perfumery and cosmetics (2002) | ||
| Country | Market value in US$ millions | World market % |
| US | 45,158 | 25 |
| Japan | 19,390 | 10 |
| France | 9,767 | 5 |
| Germany | 9,492 | 5 |
| UK | 9,492 | 5 |
| Italy | 6,887 | 4 |
| Brazil | 6,339 | 4 |
| China | 5,455 | 3 |
| South Korea | 4,897 | 3 |
| Mexico | 4,523 | 3 |
| Others | 59,058 | 34 |
| Top 10 | 120,608 | 76 |
| Source: Euromonitor | ||
| T-2. Market sizes, US$ billions (fixed exchange rate) | ||
| Global category | 2005 | % 04/05 |
| Cosmetics and toiletries | 253.3 | 4.9 |
| Baby care | 4.4 | 7.3 |
| Bath and shower products | 23.5 | 3 |
| Deodorants | 12 | 6 |
| Hair care | 50.9 | 4.1 |
| Color cosmetics | 34.5 | 4.3 |
| Men's grooming products | 20.2 | 6 |
| Oral hygiene | 24.7 | 3.7 |
| Fragrances | 27.6 | 5 |
| Skin care | 56 | 6.8 |
| Depilatories | 3.1 | 4.2 |
| Sun care | 5.5 | 7.7 |
| Note: sum of the sectors is greater than the market size because men's toiletries products are included in men's | ||
| Source: Euromonitor | ||
| T-3. Cosmetics and toiletries world market sizes—retail value US$ billions | ||
| Cosmetics and toiletries | 2005 | % 04/05 |
| World | 253.3 | 4.9 |
| Western Europe | 76.3 | 2.6 |
| Eastern Europe | 17.4 | 9.6 |
| North America | 53.9 | 3.3 |
| Latin America | 28.8 | 11.3 |
| Asia Pacific | 63.1 | 5 |
| Australasia | 3.5 | 3.1 |
| Africa and Middle East | 10.4 | 7.1 |
| Source: Euromonitor | ||
| T-4. Top 10 cosmetic companies in Brazil, 2004 | ||
| Company | Sales in US$ millions | Country of origin |
| Unilever | 2,562 | UK/ Holland |
| Avon | 1,015 | US |
| Natura | 968 | Brazil |
| Johnson & Johnson | 751 | US |
| Colgate-Palmolive | 574 | US |
| O Boticario | 375 | Brazil |
| L'Oreal | 321 | France |
| Procter & Gamble* | 161 | US |
| Beiersdorf | 132 | Germany |
| Embelleze | 114 | Brazil |
| *total sales; Source: Global Cosmetics and Toiletries 2005 (Kline Group) | ||
| T-5. Main Brazilian essential oil exports (August 2005–August 2006, in US$ millions) | |||
| Category | US$ millions | Volume (ton) | Average price US$ |
| Orange | 65.80 | 30,268.6 | 2.18 |
| Lime | 3.08 | 221.4 | 13.92 |
| Eucalyptus | 2.19 | 315.5 | 6.96 |
| Rosewood | 2.80 | 38.5 | 72.89 |
| Lemon | 6.08 | 735.6 | 8.27 |
| Other oils | 2.42 | 98.4 | 24.61 |
| Total | 82.4 | 31,678 | 2.60 |
| Source: AliceWeb, Brazil 2006 | |||